Enterprise data is only valuable when it can be understood and used to make better decisions. Businesses using Odoo often collect information from sales, inventory, accounting, purchasing, manufacturing, HR, and CRM, but turning that information into actionable insights requires the right reporting tools. This is where Odoo dashboard builder features play an important role.
Modern enterprise Odoo analytics tools help organizations transform raw business data into visual dashboards that support faster decision-making, improved operational efficiency, and better business planning. Instead of reviewing multiple reports from different modules, decision-makers can monitor key metrics from a single dashboard.
This guide explains how dashboard builders enhance enterprise analytics, the features to look for, and how businesses can maximise the value of their Odoo reporting environment.
Understanding Odoo Dashboard Builder Features
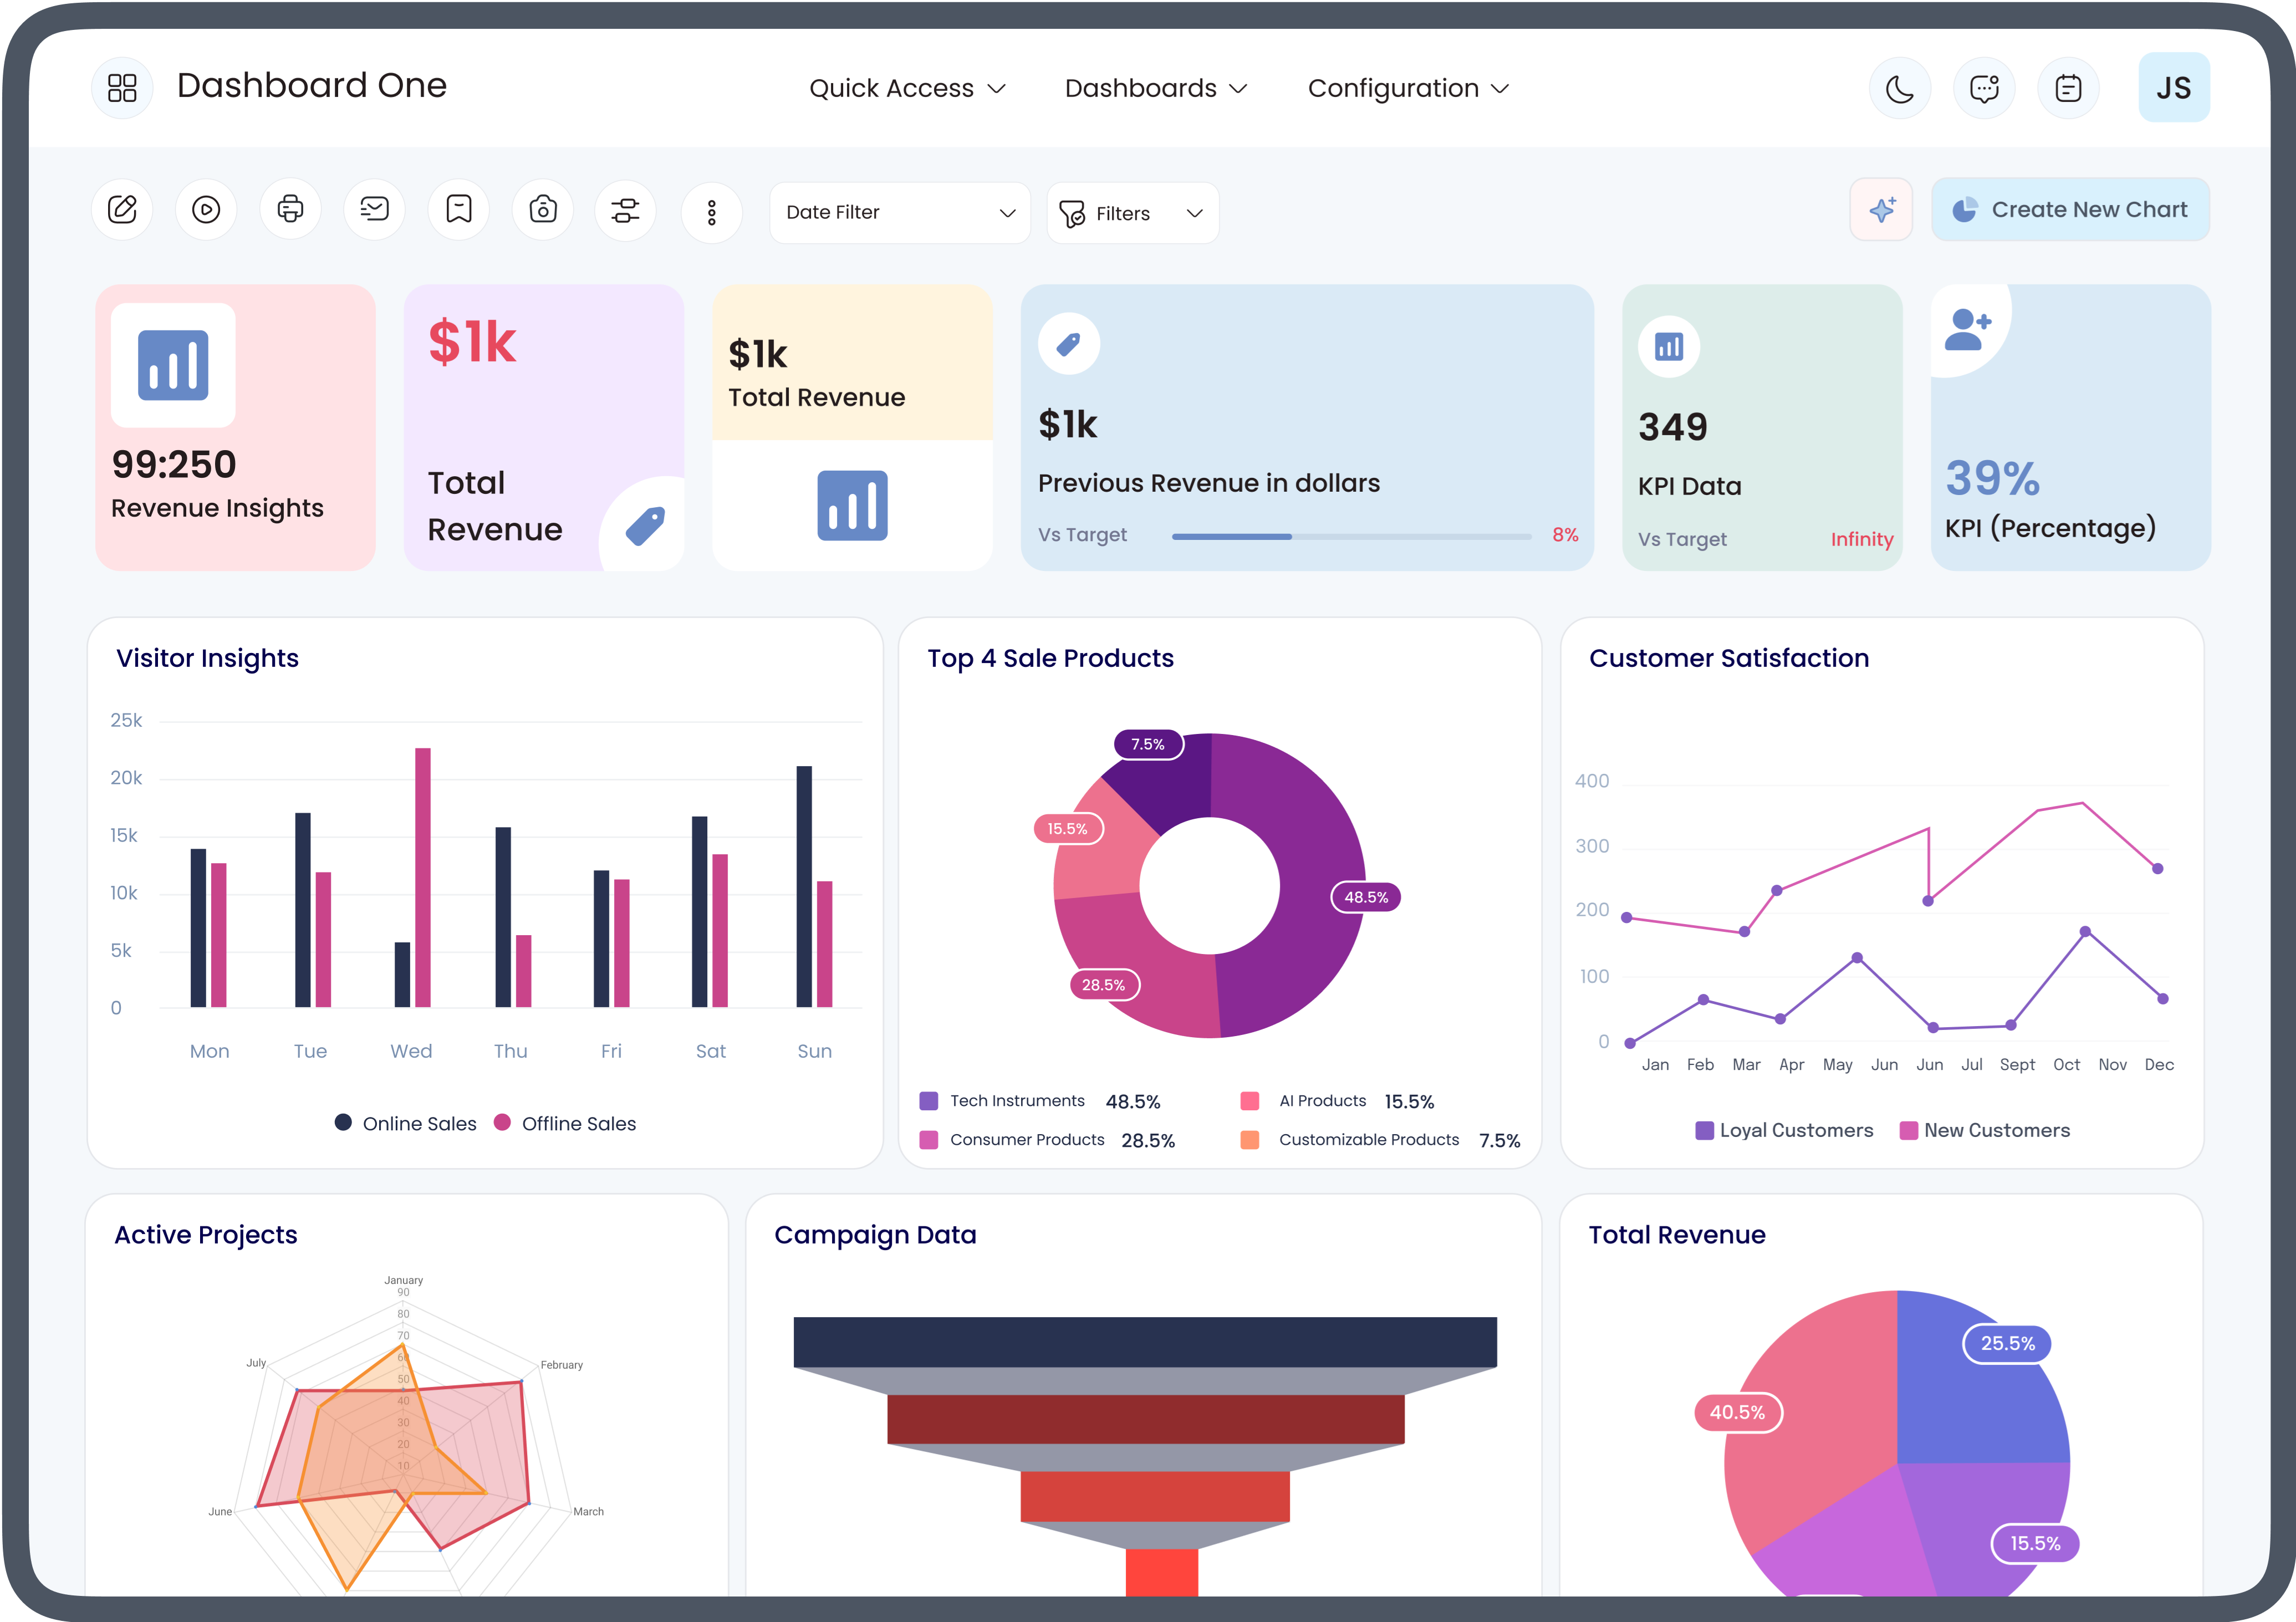
An Odoo dashboard builder is a reporting solution that enables users to create customised dashboards without extensive programming knowledge. It connects data from different Odoo applications and presents it through charts, graphs, KPI cards, tables, and other visual components.
Depending on the solution, users can customise layouts, filter information, schedule reports, and analyse business performance in real time.
Common dashboard capabilities include:
- Interactive KPI cards
- Drag-and-drop dashboard creation
- Custom charts
- Pivot tables
- Real-time reporting
- Cross-module reporting
- User-specific dashboards
- Exportable reports
These capabilities help businesses spend less time gathering data and more time analysing it.
Why Enterprise Analytics Matters
Enterprise analytics allows organisations to make informed decisions using business data instead of assumptions.
Companies rely on analytics to:
- Monitor revenue growth
- Improve customer service
- Reduce operational costs
- Increase employee productivity
- Forecast demand
- Identify business trends
- Track departmental performance
- Improve financial planning
Without centralised analytics, decision-makers often work with outdated or incomplete information.
How Odoo Dashboard Builder Features Improve Enterprise Analytics
Centralises Business Information
Businesses often use multiple Odoo modules including:
- Sales
- CRM
- Accounting
- Purchase
- Inventory
- Manufacturing
- HR
- Project Management
A dashboard builder combines information from these modules into one interface.
Instead of opening several reports, managers can immediately view:
- Sales performance
- Inventory availability
- Outstanding invoices
- Purchase trends
- Employee productivity
- Customer activities
Centralised information improves visibility across the organisation.
Enables Real-Time Decision Making
One of the biggest advantages of modern enterprise Odoo analytics tools is access to live business data.
Real-time dashboards update automatically as transactions occur.
Examples include:
- New sales orders
- Customer payments
- Inventory movements
- Purchase orders
- Manufacturing updates
Executives no longer need to wait for manual reports before making business decisions.
Simplifies Complex Data
Large organisations generate thousands of records daily.
Raw spreadsheets can be difficult to understand.
Dashboard builders convert complex information into:
- Line charts
- Pie charts
- Bar graphs
- Heat maps
- KPI widgets
- Performance indicators
Visual reports make trends much easier to identify.
Improves Executive Reporting
Executives need concise summaries rather than lengthy operational reports.
Dashboard builders allow management teams to monitor:
- Revenue
- Profitability
- Expenses
- Cash flow
- Sales targets
- Customer acquisition
- Inventory turnover
Everything can be displayed on one executive dashboard.
Supports Department-Specific Analytics
Different departments require different metrics.
Examples include:
Sales Team
- Monthly sales
- Pipeline value
- Lead conversion
- Sales by region
Finance Department
- Accounts receivable
- Accounts payable
- Cash flow
- Profit margins
Inventory Team
- Stock valuation
- Fast-moving products
- Low inventory alerts
- Warehouse performance
Human Resources
- Employee attendance
- Recruitment metrics
- Leave balances
- Workforce performance
Department-specific dashboards increase operational efficiency.
Offers Interactive Filtering
One of the most useful Odoo dashboard builder features is interactive filtering.
Users can filter reports by:
- Date range
- Company
- Salesperson
- Product
- Customer
- Warehouse
- Department
- Country
Instead of generating multiple reports, users simply adjust filters to view different business perspectives.
Improves Data Accuracy
Manual spreadsheet reporting increases the risk of errors.
Dashboard builders retrieve information directly from Odoo databases.
Benefits include:
- Reduced manual entry
- Consistent calculations
- Standardised KPIs
- Accurate reporting
Reliable data supports better business decisions.
Saves Reporting Time
Many businesses spend hours creating weekly and monthly reports.
Dashboard builders automate much of this work.
Users can:
- Save report templates
- Schedule automatic reports
- Refresh dashboards instantly
- Share dashboards with teams
Automation allows employees to focus on analysis rather than report preparation.
Enhances Collaboration
Business intelligence becomes more valuable when teams share the same information.
Dashboard builders improve collaboration by allowing teams to:
- View shared dashboards
- Track common KPIs
- Discuss performance
- Monitor business objectives
This creates greater alignment across departments.
Supports Data-Driven Forecasting
Historical business data helps organisations predict future performance.
Dashboard analytics support forecasting for:
- Sales growth
- Inventory demand
- Seasonal trends
- Production planning
- Revenue projections
Decision-makers can prepare for future business needs with greater confidence.
Key Odoo Dashboard Builder Features Businesses Should Look For
When evaluating dashboard solutions, organisations should prioritise features that support both operational reporting and executive analytics.
Important features include:
Drag-and-Drop Dashboard Creation
Allows users to build dashboards without coding.
Multiple Chart Types
Supports:
- Bar charts
- Line charts
- Area charts
- Pie charts
- Donut charts
- KPI cards
- Tables
- Pivot reports
Cross-Module Reporting
Combines information from multiple Odoo applications into one dashboard.
Real-Time Data Refresh
Ensures reports always display current business information.
Drill-Down Analysis
Users can click charts to access detailed transaction data.
Responsive Design
Dashboards should work on:
- Desktop
- Laptop
- Tablet
- Mobile devices
Role-Based Access
Different users should only view information relevant to their responsibilities.
Export Options
Reports should support exporting to:
Benefits of Enterprise Odoo Analytics Tools
Modern enterprise Odoo analytics tools provide advantages beyond standard reporting.
These include:
- Faster business decisions
- Better operational visibility
- Improved productivity
- Reduced reporting workload
- Higher data accuracy
- Easier KPI tracking
- Stronger financial monitoring
- Better forecasting
- Increased transparency
- Improved executive reporting
These benefits help organisations become more agile and responsive.
Best Practices for Building Effective Odoo Dashboards
To maximise dashboard effectiveness:
Define Clear KPIs
Identify the metrics that directly support business goals.
Avoid Information Overload
Display only the most important indicators.
Update Dashboards Regularly
Ensure dashboards reflect current business requirements.
Standardise Metrics
Use consistent KPI definitions across departments.
Train Users
Employees should understand how to interpret dashboards correctly.
Monitor Dashboard Performance
Review whether dashboards continue meeting business needs as the organisation grows.
Common Challenges in Enterprise Analytics
Businesses may encounter several reporting challenges.
These include:
- Inconsistent data sources
- Poor dashboard design
- Too many KPIs
- Lack of user adoption
- Manual reporting processes
- Inadequate data governance
Choosing the right dashboard strategy helps minimise these issues.
Future Trends in Odoo Enterprise Analytics
Analytics technology continues to evolve.
Future enhancements may include:
- AI-assisted insights
- Predictive analytics
- Natural language reporting
- Automated anomaly detection
- Enhanced mobile dashboards
- Advanced data visualisation
- Improved cross-platform integrations
Businesses that adopt modern analytics capabilities will be better positioned to respond to changing market conditions.
Conclusion
Effective reporting is essential for modern business management, and Odoo dashboard builder features provide the flexibility needed to transform operational data into meaningful insights. By combining information from multiple business functions into interactive, real-time dashboards, organisations can improve visibility, streamline reporting, and support faster decision-making.
When paired with robust enterprise Odoo analytics tools, these dashboards enable teams at every level—from operational staff to executives—to monitor performance, identify trends, and act with confidence. Investing in a well-designed analytics environment not only improves efficiency but also creates a stronger foundation for sustainable business growth.




 English
 Arabic
 French
 Spanish
 Portuguese
 Deutsch
 Turkish
 Dutch
Dutch
 Russian
 Romaian
 Portuguese (Brazil)
 Greek
Greek
