


Smartphones Lead India's Exports potential at $94 Billion by 2031 — But $30.1 Billion in Untapped Markets Is the Real Story
Smartphones Lead India's Exports potential at $94 Billion by 2031 — But $30.1 Billion in Untapped Markets Is the Real Story
In 2031, while the United States constitutes 27% (largest) of India's existing export potential, it is Japan (12.32%) and China (11.14%) that emerge as the most promising markets for entirely new product lines — signalling India's untapped export opportunities beyond existing trade portfolio, as highlighted in the India Export Attractiveness Tracker 2026.
The New Growth Frontier: Japan, the US and China
Looking for current product lines in 2031, India's export potential remains firmly anchored by its existing trading partners, led by the United States at USD 213.68 billion — 27% of the total opportunity. China follows at USD 79.48 billion (10%), with Hong Kong close behind at USD 51.79 billion (7%), while Japan (USD 43.51 billion) and Canada (USD 27.45 billion) round out a top five that underscores how much of India's export economy still rests on a handful of large, established markets.
|
Top 5 Current Leading Importers |
Export Potential (USD Bn) |
Top 5 New Potential Importers |
Export Potential (USD Bn) |
|
United States |
213.68 |
Japan |
3.71 |
|
China |
79.48 |
United States |
3.35 |
|
Hong Kong |
51.79 |
China |
3.10 |
|
Japan |
43.51 |
Mexico |
2.90 |
|
Canada |
27.45 |
Vietnam |
0.96 |
Source: 6WExportGTM
However, India's growth story is set to diversify through new product lines where India currently has minimal trade, rather than through its trade relationships as a whole. Japan emerges as the top new-potential market for such products at USD 3.71 billion (12.32%), followed by additional headroom in the United States (USD 3.35 billion, 11.14%) and China (USD 3.10 billion, 10.30%) — showing that even existing partners hold room to grow through categories India has yet to tap. Mexico enters as a fresh strategic opportunity at USD 2.90 billion (9.62%), while Vietnam adds USD 0.96 billion (3.18%), signalling India's potential to expand into new product segments across Latin America and Southeast Asia's growing manufacturing base.
Where New Trade Corridors Open First
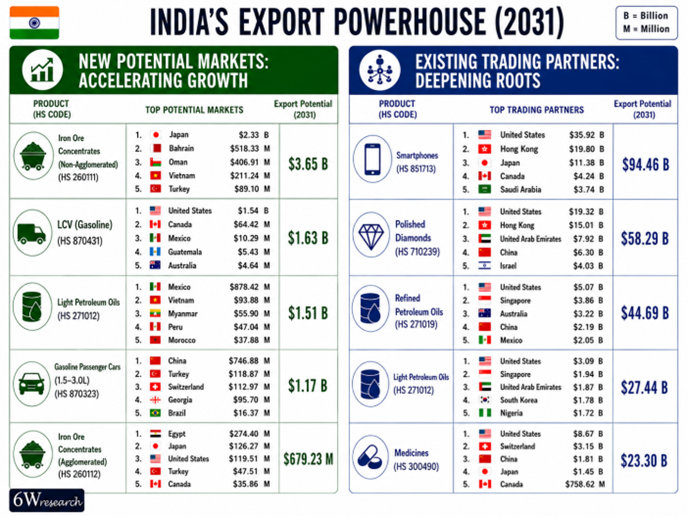
Iron ore, LCVs and light petroleum oils lead the way. While India currently has minimal trade with these countries — for example, iron ore concentrates (non-agglomerated) with Japan, or LCV (Gasoline) with the United States — analysis by 6WExportGTM shows substantial untapped export opportunities projected to emerge by 2031, creating significant scope for market diversification.
Iron Ore Concentrates (Non-Agglomerated) top the list of emerging opportunities, offering a combined potential of USD 3.65 billion by 2031, with the top five markets alone accounting for USD 3.56 billion. Japan is the standout at USD 2.33 billion, as its steel mills remain heavily dependent on imported ore amid constrained domestic mining capacity; while Australia and Brazil currently dominate Japanese imports, improving India-Japan ties and expanding mining and port infrastructure could gradually strengthen India's position as a competitive alternative supplier. Bahrain (USD 518.33 million) and Oman (USD 406.91 million) add further headroom on the back of growing aluminium, steel and infrastructure demand, while Vietnam (USD 211.24 million) and Turkey (USD 89.10 million) round out a list driven by diversifying steel supply chains.
LCV (Gasoline) follows closely, adding USD 1.63 billion in potential — the United States alone accounts for USD 1.5 billion of it, fuelled by the e-commerce and same-day-delivery boom pushing fleet operators to look beyond conventional sources for reliable, cost-efficient commercial vehicles. Canada, Mexico, Guatemala and Australia contribute smaller volumes on similar logistics-growth trends. Light oil adds a further USD 1.5 billion, led by Mexico at USD 878 million on strengthening energy trade links; Gasoline Passenger Cars (1.5–3.0L) add USD 1.17 billion, led by China at USD 746 million; and iron ore concentrates (agglomerated) contribute USD 679 million, led by Egypt at USD 274 million.
The Core Engine: Smartphones, Diamonds, Petroleum and Medicines
Smartphones, polished diamonds, refined petroleum, and generic medicines represent India’s highest-value future export potential by 2031, driven by expanding demand across its established global trading partners. Projections indicate massive long-term potential in key markets, led by the US across smartphones (USD 35.9B) and medicines (USD 8.6B), alongside substantial growth opportunities across traditional hubs like Hong Kong, the UAE, Singapore, and Japan.
Smartphones remain India's single largest opportunity. Total potential is estimated at USD 94.5 billion by 2031, of which the top five importing countries account for USD 75.08 billion. The United States leads at USD 35.9 billion on continued supply-chain diversification and incentive-linked assembly expansion within India; Hong Kong follows at USD 19.8 billion as a re-export gateway into wider Asian demand; and Japan adds USD 11.3 billion as regional buyers broaden their sourcing base.
Polished Diamonds add a further USD 58.2 billion, led by the United States (USD 19.3 billion) and Hong Kong (USD 15.1 billion) — both long-established gem-trading centers — alongside the UAE (USD 7.9 billion), where Dubai's expanding role as a re-export hub continues to drive trade flows. Light and Refined Petroleum Oils together contribute USD 44.7 billion, led by the United States and Singapore, with China's rising demand for refined fuel adding further volume. Medicines close out the core list at USD 23.3 billion, led by the United States at USD 8.6 billion on India's scale in cost-competitive generic manufacturing, with Switzerland adding USD 3.1 billion as a specialty generic trade hub.
Medicines Lead India's $66.81 Billion Pharma Bet — But a 200% US Tariff Cloud Looms
Medicines alone carry export potential of USD 23.30 billion by 2031, led by the United States (USD 8.67B), Switzerland (USD 3.15B), China (USD 1.81B), Japan (USD 1.45B) and Canada (USD 758.62M). Zooming out, the pharmaceuticals sector scales this to USD 66.81 billion, with the US alone accounting for USD 20.13 billion — nearly a third of the total — followed by China (USD 8.79B), Switzerland (USD 5.68B), Japan (USD 4.23B) and Brazil (USD 3.36B). That heavy US concentration, across both the product and the sector, is now a live risk: on July 21, 2026, Trump announced a phased tariff on generic drugs — 0% through July 2028, 100% for a year, then 200% from August 2029 — aimed at reshoring generic manufacturing to the US. Since India supplies ~40–47% of US generic prescriptions (worth ~USD 9.7 billion today), the two-year buffer protects near-term sales, but it puts a hard deadline on India's single largest pharma market, which is already why Indian pharma stocks reacted on the news despite the grace period.
|
India's strongest export priorities remain smartphones, polished diamonds and pharmaceuticals into the United States and Hong Kong, supported by growing medicines trade positioning into Switzerland and China, and a widening petroleum footprint across Singapore and emerging refining-constrained markets. |
Semiconductors: India's Long-Term Play
Semiconductors present a strong long-term opportunity for India. Global demand for chips continues to accelerate, driven by rapid growth in artificial intelligence, hyperscale data centers, smartphones, electric vehicles, cloud computing and industrial automation. This trend is reflected across semiconductor-related product categories, led by Electronic Integrated Circuits (USD 685.7B), Refined Petroleum Oils (USD 668.4B) and Light Petroleum Oils (USD 588.9B). While these figures represent export opportunities for key integrated-circuit products rather than the entire semiconductor value chain, they underscore the significant potential for India to expand its role in chip assembly, packaging, testing, electronics manufacturing services (EMS) and advanced semiconductor manufacturing.
|
Sustained investments in AI infrastructure, cloud computing and next-generation electronics are making semiconductors one of India's most promising long-term export sectors. — Manish Pant, Senior Data Scientist, Data Science & Market Intelligence, 6Wresearch |
|
India's expanding semiconductor ecosystem — supported by government incentives, global supply-chain diversification and increasing electronics manufacturing capacity — positions the country to strengthen its competitiveness in high-value technology exports over the coming decade. — Manisha Gupta, Data Analyst, Data Science & Market Intelligence, 6Wresearch |
Top Global Export Opportunities (2031), By Product
|
Product |
Export Opportunity (USD Bn) |
|
Electronic Integrated Circuits |
685.7 |
|
Refined Petroleum Oils |
668.4 |
|
Light Petroleum Oils |
588.9 |
|
Logic Integrated Circuits |
507.9 |
|
Medicines |
381.2 |
|
Gasoline Passenger Cars (1.5–3.0L) |
360.9 |
|
Smartphones |
343.6 |
|
Memory Integrated Circuits |
333.2 |
|
Data Transmission Equipment |
216.9 |
|
Human Vaccines |
209.6 |
Excludes naturally occurring products (e.g. crude oil, raw gold). Source: 6WExportGTM
Globally, the largest export opportunities beyond naturally occurring products are concentrated in electronics, energy and medicines — highlighting the growing dominance of semiconductors, advanced manufacturing and high-value technology products in global trade.
India's Current Trade Anchors
A handful of established sectors, supported by scaled domestic industrial capacity, underpin India’s current trade base. Oil & Gas leads at USD 69.07 billion, split out by refined petroleum oils (71.4%) and light petroleum oils (28.6%). Telecommunications Equipment follows at USD 23.20 billion, almost entirely smartphones (86.8%), while Pharmaceuticals contributes USD 32.56 billion, led by medicines (54.1%).
|
Sector |
Exports |
Leading Products / Share |
|
Oil & Gas |
USD 69.07B |
Refined Petroleum Oils (71.4%), Light Petroleum Oils (28.6%) |
|
Pharmaceuticals |
USD 32.56B |
Medicines (54.1%) |
|
Telecommunications Equipment |
USD 23.2B |
Smartphones (86.8%) |
Source: UN Comtrade
By trading value, three markets stand out. The United States leads at USD 79.4 billion, led by medicines (9.6% share) and smartphones (8.8%). The United Arab Emirates follows at USD 37.1 billion, led by precious metal jewelry (13.4%) and light petroleum oils (10.1%), reflecting Dubai's role as a global gold and jewelry trading hub. The Netherlands rounds out the top three at USD 24.2 billion, led by refined petroleum oils (61.3%), reflecting Rotterdam's role as one of Europe's largest refining and fuel-distribution gateways.
|
Country |
Exports |
Leading Products / Share |
|
United States |
USD 79.4B |
Medicines (9.6%), Smartphones (8.8%) |
|
United Arab Emirates |
USD 37.1B |
Precious Metal Jewelry (13.4%), Light Petroleum Oils (10.1%) |
|
Netherlands |
USD 24.2B |
Refined Petroleum Oils (61.3%) |
Source: UN Comtrade
Trade Agreements: India's Next Export Frontier
Tariff structures across India's emerging export destinations reveal a bifurcated opportunity set, where market-entry strategy must be calibrated to each country's duty regime rather than pursued uniformly. Japan and Egypt offer immediate, largely frictionless access for iron ore concentrates — both admitted duty-free — allowing Indian exporters to compete purely on cost, supply consistency and quality. Mexico presents a similarly open runway for light petroleum oils at a 0% applied tariff.
By contrast, the United States and China illustrate markets where tariff architecture still constrains India's competitiveness, even as the picture actively shifts. LCV (Gasoline) exports to the US attracted a 25% duty in the past but the framework agreed under the India – US Interim Trade Agreement in February 2026, which reduced the effective US baseline tariff on Indian goods to 10%, and set a roadmap for a wider Bilateral Trade Agreement, shows suggestive easing of this barrier. China's 15% applied tariff on gasoline passenger cars, moderated to 13.5% under APTA preferences, similarly shows how existing regional frameworks already deliver partial relief.
|
Country |
Product |
Applied Tariff |
Preferential Tariff |
|
Japan |
Iron Ore Concentrates (Non-Agglomerated) |
0% |
— |
|
United States |
LCV (Gasoline) |
25% |
— |
|
Mexico |
Light Petroleum Oils |
0% |
— |
|
China |
Gasoline Passenger Cars (1.5–3.0L) |
15% |
13.5% (APTA) |
|
Egypt |
Iron Ore Concentrates (Agglomerated) |
0% |
— |
Source: MacMap (ITC)

 English
 Arabic
 French
 Portuguese
 Deutsch
 Turkish
 Dutch
Dutch
 Italiano
 Russian
 Romaian
 Portuguese (Brazil)
 Greek
Greek
