


Lighting-as-a-Service Market to Reach USD 13.5 Billion by 2036 as Corporate Decarbonization Initiatives Drive 19.8% CAGR
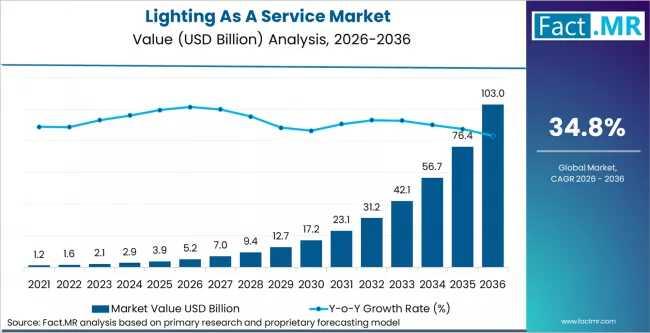
Global corporate sustainability initiatives and rising commercial electricity costs are driving a major architectural shift as facilities managers move away from capital-intensive lighting purchases toward subscription-based, managed energy models. According to an extensive new market evaluation published by Fact.MR, the global lighting-as-a-service market crossed an initial industry valuation of USD 1.8 billion in 2025. Spurred by aggressive energy efficiency targets and the rapid adoption of turnkey retrofitting programs, the market is estimated to reach USD 2.2 billion in 2026. Looking toward the conclusion of the ten-year forecast horizon, the global industry is projected to reach an absolute market valuation of USD 13.5 billion by 2036. This trajectory represents a compound annual growth rate (CAGR) of 19.8% from 2026 to 2036, offering an absolute dollar opportunity of USD 11.3 billion for service providers, fixture manufacturers, and institutional real estate investors.
Get detailed market forecasts, competitive benchmarking, and pricing trends:
Key Market Highlights at a Glance
- Market Size in 2025 (Base Year): USD 1.8 billion
- Estimated Market Size in 2026: USD 2.2 billion
- Projected Market Size by 2036 (Forecast Year): USD 13.5 billion
- Compound Annual Growth Rate (CAGR): 19.8% between 2026 and 2036
- Absolute Dollar Opportunity: USD 11.3 billion over the forecast window
- Dominant Component Segment: Luminaires and Equipment holding a 52.4% market share in 2026
- Leading End-Use Vertical: Commercial Real Estate capturing a 45.2% market share in 2026
- Primary Installation Type: Indoor Lighting commanding a 63.8% market share in 2026
- Fastest-Growing National Market: India expanding at a 21.6% CAGR
- Total Report Volume: 170 comprehensive pages
Why Is the Lighting-as-a-Service Market Growing?
- Elimination of Upfront Capital Expenditure: The subscription model allows corporate facilities to shift expensive light-emitting diode (LED) infrastructure upgrades from capital budgets into ongoing operating expenses.
- Stringent Global Decarbonization Mandates: International environmental compliance standards are forcing property managers to reduce building energy usage intensity profiles or face severe financial penalties.
- Proliferation of Smart Building Ecosystems: Modern commercial building designs incorporate internet-of-things (IoT) environmental sensors directly into lighting networks, turning simple fixtures into complex data nodes.
"Commercial facility managers are no longer just buying illumination; they are purchasing optimized energy performance," states Shambhu Nath Jha, Senior Analyst at Fact.MR. "The operational friction of maintaining custom building infrastructure makes traditional procurement models inefficient. Real estate portfolios are turning to specialized subscription vendors that manage everything from initial layout design to multi-year maintenance and optimization under guaranteed energy-saving frameworks."
Which Component Leads the Lighting-as-a-Service Market Share?
The core physical infrastructure of any building efficiency upgrade requires advanced, low-energy solid-state illumination hardware. The luminaires and equipment component segment is expected to garner a 52.4% share of the overall market in 2026. This leading share position is driven by the immediate necessity for widespread property retrofits replacing legacy fluorescent and high-intensity discharge bulbs with modern LED products. While software-defined dimming schedules and ongoing maintenance services remain critical, the high upfront value of advanced architectural fixtures keeps hardware at the center of multi-year infrastructure agreements.
- Luminaires and Equipment Market Share: 52.4% of the overall marketplace in 2026
- Core Functional Infrastructure: Smart LED fixtures, specialized driving ballast units, and integrated occupancy sensors
- Market Integration Value: Lowers immediate building energy draw by up to sixty percent upon initial physical installation
Which End-Use Vertical Generates the Highest Contract Volume?
Regulated corporate workspaces and large multi-tenant office complexes require highly predictable operational structures to keep overhead costs low. The commercial real estate vertical is forecast to record a 45.2% share of the market in 2026. This major market share is shaped by the expansion of green building certifications and the rising demand for premium office space featuring intelligent ambient control profiles. Industrial warehouse complexes and municipal outdoor networks also represent high-growth sectors, but commercial workspaces remain the primary driver of subscription-based illumination contract volume globally.
- Commercial Real Estate Market Share: 45.2% of global end-use demand in 2026
- Volume Catalyst: Thousands of corporate office retrofits aiming to meet strict corporate environment, social, and governance (ESG) goals
- Operational Focus: Integrating automated workplace schedules to lower daily power usage without disrupting tenant comfort
What Installation Type Dominates the Industry?
Continuous interior property operations demand consistent, comfortable visual conditions across extensive working environments. Indoor lighting configurations are estimated to represent a 63.8% share of the market in 2026. This installation type leads the market because indoor corporate real estate spaces run for prolonged daily periods compared to localized outdoor facilities. By standardizing interior lighting asset management, enterprises can reliably reduce structural electricity draw across office floors, retail displays, and hospital rooms.
- Indoor Lighting Market Share: 63.8% of the global installation landscape in 2026
- Operational Advantage: Provides continuous workspace illumination while capturing real-time occupancy data for HVAC optimization
- Secondary Segments: Outdoor and municipal infrastructure installations optimize public highway systems and localized industrial yard networks
Market Dynamics
Core Market Drivers
The primary driver accelerating global industry expansion is the widespread shift from upfront capital expense structures to flexible operating expense subscriptions. Furthermore, the rapid growth of strict international building codes requires commercial property groups to deploy highly efficient, low-carbon building ecosystems. These elements encourage real estate portfolios to utilize zero-down managed service contracts.
Primary Market Restraints
The primary restraint limiting immediate global adoption is the persistence of long-term contract commitment concerns among small-business property owners. When service agreements span across five to ten years, tenants with shorter lease durations often hesitate to sign complex infrastructure commitments. This structural mismatch slows down multi-tenant commercial real estate deployment timelines.
Prominent Industry Trends
The most significant trend defining the current landscape is the deep integration of internet-of-things (IoT) environmental sensors into managed illumination fixtures. Modern building engineering groups are utilizing these integrated sensor nodes to gather real-time data on room occupancy, ambient temperature, and indoor air quality. Additionally, providers are introducing predictive maintenance algorithms that detect fixture degradation before an actual hardware failure occurs.
Regional Outlook: India Records Rapid Growth Amid Smart City Infrastructure Expansion
The global requirement for modernized, low-energy building infrastructure is generating high compound growth rates across expanding digital economies and established Western real estate hubs.
- India Forecasted Growth Rate: 21.6% CAGR from 2026 to 2036
- China Forecasted Growth Rate: 20.9% CAGR from 2026 to 2036
- Australia Forecasted Growth Rate: 19.5% CAGR from 2026 to 2036
- United Kingdom Forecasted Growth Rate: 19.1% CAGR from 2026 to 2036
- United States Forecasted Growth Rate: 18.2% CAGR from 2026 to 2036
India is expected to record a 21.6% CAGR between 2026 and 2036, leading the global market in growth speed. This rapid expansion is driven by extensive domestic smart city modernization campaigns and deep institutional investments in new energy-efficient commercial real estate developments.
China is projected to post a 20.9% CAGR during the forecast decade. High growth is supported by massive national industrial modernization initiatives and large-scale manufacturing facilities seeking to lower structural operating expenses.
Australia is anticipated to advance at an 19.5% CAGR over the assessment timeframe. This development is heavily propelled by strict regional carbon emission reduction targets and rising corporate adoption of managed smart building infrastructure.
The United Kingdom is estimated to record a 19.1% CAGR across the 2026 to 2036 period. Market momentum is sustained by mature commercial energy efficiency mandates and widespread adoption of subscription business models by municipal councils.
The United States is forecast to post an 18.2% CAGR over the forecast horizon. Growth is shaped by the immense scale of domestic commercial real estate networks and sophisticated utility rebate programs that lower the long-term cost of managed service transitions.
Competitive Landscape: Strategic Focus on Energy Performance Guarantees
The competitive environment within the lighting-as-a-service sector is expanding quickly as specialized energy services companies compete with established multinational lighting manufacturers.
- Signify Holding: Deploys extensive connected illumination portfolios under its Interact brand, combining hardware with long-term performance contracts.
- Acuity Brands: Focuses on intelligent architectural lighting systems and integrated building management software tailored for commercial real estate networks.
- Zumtobel Group: Deloys flexible turnkey service configurations across European commercial markets to streamline industrial workspace modernization.
- Stouch Lighting: Specializes in regional commercial retrofits by combining custom facility layout design with localized utility rebate management.
Competitive dynamics show that simple hardware provisioning is no longer a core differentiator. Modern market leaders are heavily prioritizing advanced software-driven analytics, automated utility rebate processing, and guaranteed energy reduction metrics. This service focus allows commercial procurement managers to comfortably modernize large facility portfolios while passing technology obsolescence risks entirely to the managed service partner.
Frequently Asked Questions
What is the projected global value of the lighting-as-a-service market by 2036?
The global lighting-as-a-service market is projected to reach an absolute market valuation of USD 13.5 billion by the year 2036.
What is the expected compound annual growth rate of the lighting-as-a-service industry?
The lighting-as-a-service market is expected to expand at a compound annual growth rate (CAGR) of 19.8% from 2026 to 2036.
Which component holds the largest share within the global lighting-as-a-service industry?
The luminaires and equipment component segment holds the largest market position, controlling a 52.4% share of the global market in 2026.
What end-use vertical leads the lighting-as-a-service industry in terms of market share?
The commercial real estate vertical dominates the end-use space, capturing a 45.2% share of the global lighting-as-a-service market in 2026.
Which installation type represents the primary implementation for managed lighting models?
Indoor lighting configurations represent the dominant installation type, holding a 63.8% market share in 2026.
What country is recorded as the fastest-growing market for lighting-as-a-service solutions?
India is the fastest-growing national market for lighting-as-a-service frameworks, expanding at a projected 21.6% CAGR between 2026 and 2036.
Who are the prominent enterprise technology vendors listed within the lighting-as-a-service industry report?
The prominent players operating inside the global industry include Signify Holding, Acuity Brands, Zumtobel Group, and Stouch Lighting.
About Fact.MR
Fact.MR is a global market research and consulting firm, trusted by Fortune 500 companies and emerging businesses for reliable insights and strategic intelligence. With a presence across the U.S., UK, India, and Dubai, we deliver data-driven research and tailored consulting solutions across 30+ industries and 1,000+ markets. Backed by deep expertise and advanced analytics, Fact.MR helps organizations uncover opportunities, reduce risks, and make informed decisions for sustainable growth.
- Contact Us -
11140 Rockville Pike, Suite 400, Rockville,
MD 20852, United States
Tel: +1 (628) 251-1583 | sales@factmr.com

 English
 Arabic
 French
 Spanish
 Portuguese
 Turkish
 Dutch
Dutch
 Italiano
 Russian
 Romaian
 Portuguese (Brazil)
 Greek
Greek
