


6Wresearch | Australia Export Potential 2031: USD 24.07B in New Markets
Beyond Established Trade Partners, Untapped Markets Could Add USD 24.07 Billion to Australia’s USD 344.86 Billion Export Potential by 2031
By 2031, China is projected to account for 44.35% of Australia’s export potential across existing product lines nearly four times Japan’s second-ranked share. However, the United States and India are expected to dominate opportunities across entirely new product lines, accounting for 37.19% and 21.96%, respectively. This divergence highlights Australia’s emerging trade challenge: the market that has historically anchored its export economy is increasingly different from the markets likely to drive its next phase of growth.
Source: 6WExportGTM
China, Japan and South Korea Anchor Australia's Exports as the United States and India Lead New Growth Opportunities
Australia's export strategy for 2031 rests on a trade base built almost entirely on resources iron ore, Coal (Non-Agglomerated), gold and gas sold overwhelmingly into Asia, while a much smaller set of new corridors is starting to point somewhere else entirely. In established trade relationships, export potential reaches USD 320.79 billion, led by China at 44.35% (USD 142.28 billion), more than three times the share of second-placed Japan at 11.86% (USD 38.06 billion). South Korea, India and the United States round out the top five, confirming that Australia's resource exports remain functionally a single-customer story, even with four other significant buyers in the mix.
|
Top 5 Current Leading Importers |
Export Potential (USD Billion) |
Top 5 New Potential Importers for New Product Lines |
Export Potential (USD Billion) |
|
China |
142.28 |
United States |
8.95 |
|
Japan |
38.06 |
India |
5.29 |
|
South Korea |
22.00 |
China |
1.65 |
|
India |
17.78 |
Canada |
0.68 |
|
United States |
16.75 |
Turkey |
0.62 |
The new-corridor picture flips this pattern almost entirely. Australia's export potential in entirely new product-country pairs stands at USD 24.07 billion, and here the United States leads at 37.19% (USD 8.95 billion) with India second at 21.96% (USD 5.29 billion) together accounting for close to six in every ten dollars of new opportunity. China still appears, but at a comparatively modest 6.84% (USD 1.65 billion), a sharp contrast to its dominance of established trade. For a country whose resource exports have been synonymous with Chinese demand for two decades, the shape of this new-corridor list is arguably the most important signal in this entire report.
Crude Petroleum, LNG and Coal Lead Australia's Next Export Growth Markets
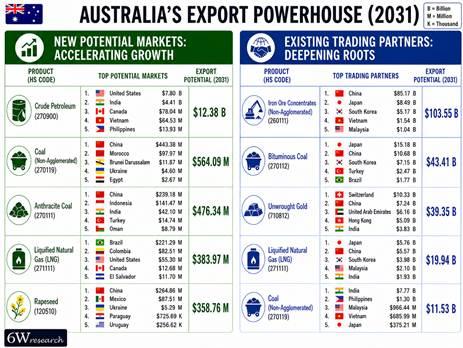
Crude petroleum, Coal (Non-Agglomerated) and anthracite coal lead the way. While Australia currently has minimal trade with several of these destinations, analysis by 6WExportGTM, a part of 6Wreseach, shows real untapped export opportunity emerging by 2031 concentrated far more in energy and agricultural commodities than in the metals and minerals that define Australia's existing trade.
Crude petroleum dominates this list at USD 12.38 billion, led by the United States (USD 7.80 billion) and India (USD 4.41 billion), with Canada, Vietnam and the Philippines trailing well behind a pairing that stands out precisely because neither the US nor India is currently a major destination for Australian crude. Thermal coal adds a further USD 0.56 billion, led by China (USD 0.44 billion) even within this new-corridor bracket, alongside Morocco, Brunei, Ukraine and Egypt. Anthracite coal follows at USD 0.48 billion, again led by China (USD 0.24 billion) and Indonesia (USD 0.14 billion).
Liquefied Natural Gas contributes USD 0.38 billion in new-corridor potential, led by Brazil (USD 0.22 billion) and Colombia (USD 0.08 billion), while rapeseed rounds out the top five at USD 0.36 billion, led by China (USD 0.26 billion) and Mexico (USD 0.09 billion) a reminder that even Australia's agricultural exports remain, in aggregate, tilted toward the same Chinese demand base that dominates its resource trade.
Iron Ore, Coal (Non-Agglomerated) and Gold Dominate Australia’s Existing Markets Export Potential
Iron ore, bituminous coal and unwrought gold represent Australia's highest-value existing export potential by 2031, and the country's position as a low-cost, logistically embedded resource supplier to Asia underpins all three.
Iron ore concentrates (non-agglomerated) carry by far the largest opportunity at USD 103.55 billion, led by China (USD 85.17 billion) a single buyer relationship worth more than the next four countries combined followed by Japan (USD 8.49 billion), South Korea (USD 5.17 billion), Vietnam and Malaysia. Bituminous coal follows at USD 43.41 billion, led by Japan (USD 15.18 billion) ahead of China (USD 10.68 billion), with South Korea, Turkey and Brazil rounding out a notably more diversified buyer base than iron ore. Unwrought gold adds USD 39.35 billion, led by Switzerland (USD 10.33 billion) reflecting Switzerland's role as a global bullion refining and trading hub rather than end demand followed by China, the UAE, Hong Kong and India.
Liquefied Natural Gas contributes USD 19.94 billion, led by Japan (USD 5.76 billion) and China (USD 5.57 billion) in a near-even split, with South Korea, Malaysia and India completing the top five. A second coal category rounds out the list at USD 11.53 billion, this time led decisively by India (USD 7.77 billion) rather than the Northeast Asian buyers that dominate bituminous coal, with the Philippines, Malaysia, Vietnam and Japan trailing behind a useful reminder that Australia's coal trade is really two distinct stories, one Northeast Asian and industrial, the other South and Southeast Asian and more power-generation led.
|
Australia's strongest export priorities remain iron ore, Coal (Non-Agglomerated), and gold into China, Japan and South Korea, but the country's next wave of growth in crude petroleum, critical minerals and diversified coal demand is increasingly a United States and India story rather than a Chinese one. 6WExportGTM Analysis |
How Australia Is Strengthening Its Global Export Position
Australia’s export outlook through 2031 will depend less on identifying new buyers for iron ore and more on responding to three immediate pressures: the emergence of a credible new iron ore competitor, a rapidly expanding critical-minerals partnership with the United States aimed at reducing dependence on China, and a shifting US tariff environment that continues to affect even close allies. With China accounting for 44% of Australia’s established export potential, the country’s ability to manage these pressures will be more consequential than any single new trade corridor identified in this report.
Digging for Leverage: The Critical Minerals Pivot
While Beijing diversifies its iron ore supply, Canberra is doing the same in reverse for critical minerals. The US-Australia Framework for Securing Supply in Critical Minerals and Rare Earths, signed in October 2025, commits both governments to at least USD 1 billion each in near-term financing, part of a pipeline targeting an estimated USD 8.5 billion in projects. Early beneficiaries include a USD 200 million equity stake in Alcoa's high-purity gallium refinery in Western Australia and a USD 100 million commitment to Gina Rinehart-backed Arafura's Nolans rare earths project, alongside more than USD 2.2 billion in letters of interest issued by the US Export-Import Bank across six further Australian projects. The inaugural Mining, Minerals and Metals Investment Ministerial convened in Tokyo in March 2026 to keep the pipeline moving a level of bilateral institutional follow-through that goes well beyond the resource trade Australia has historically run with the US.
|
Australia’s priority should now be to convert bilateral commitments into commercially operating projects by securing binding finance, long-term US offtake agreements and targeted support for processing facilities that can remain competitive at scale. Faster project delivery will also require coordinated infrastructure and approvals, while maintaining strong environmental standards and meaningful First Nations engagement.
Manisha Gupta, Data Analyst, Data Science & Market Intelligence, 6Wresearch |
Energy at a Crossroads: Coal and Gas Meet the Transition
Australia's coal and gas trade is quietly bifurcating by buyer. India's USD 7.77 billion coal opportunity and the broader South/Southeast Asian demand base (Philippines, Malaysia, Vietnam) reflect continued power-generation-led growth, while the Northeast Asian bituminous coal and LNG relationships with Japan, China and South Korea sit closer to a plateau as China's steel demand declines and Japan pursues its own energy transition. IEEFA's April 2026 analysis frames this directly as a crossroads moment for Australian iron ore and, by extension, its broader resource exports asking whether the sector doubles down on business-as-usual volume or begins investing in lower-carbon "green iron" and processed exports that could command premium pricing as global buyers face their own decarbonization pressure.
|
Australia should gradually reposition its coal and gas strategy from volume-led exports toward lower-carbon, higher-value products by investing in green iron, cleaner processing technologies and premium-grade resource exports, while continuing to serve near-term demand growth across India and Southeast Asia. Manish Pant, Senior Data Scientist, Data Science & Market Intelligence, 6Wresearch |
Top Global Export Opportunities (2031), By Product
|
Product |
Export Opportunity (USD Billion) |
|
Electronic Integrated Circuits |
685.7 |
|
Refined Petroleum Oils |
668.4 |
|
Light Petroleum Oils |
588.9 |
|
Logic electronic integrated circuits |
507.9 |
|
Medicines |
381.2 |
|
Gasoline Passenger Cars (1.5–3.0L) |
360.9 |
|
Smartphones |
343.6 |
|
Electronic integrated circuits with memory |
333.2 |
|
Data Transmission Equipment |
216.9 |
|
Immunological Products |
209.6 |
Excludes naturally occurring products (e.g., crude oil, raw gold). Source: 6WExportGTM
Globally, the largest export opportunities beyond naturally occurring products are concentrated in electronics, energy and pharmaceuticals highlighting the growing dominance of semiconductors, advanced manufacturing and high-value technology products in global trade. Japan already sits inside several of these categories, but its real priority through 2031 is defending semiconductor-equipment leadership, stabilizing its auto industry through a difficult transition, and using energy and metals diversification to reduce the geopolitical exposure that comes with a resource-poor, trade-dependent economy.
What Australia Already Sells, and to Whom
Metallic ores dominate Australia’s established trade base, reaching USD 92.57 billion. Non-agglomerated iron ore concentrates account for 88.44% of the sector, while copper ore contributes a further 4.50%. Coal follows at USD 56.73 billion and remains highly concentrated, with bituminous coal representing 99.6% of total sector exports and anthracite coal accounting for the remaining 0.4%. Oil and gas ranks third at USD 56.36 billion, led by liquefied natural gas at 78.99%, followed by crude petroleum at 12.53%.
|
Sector |
Exports (USD Billion) |
Leading Products / Share |
|
Metallic Ores |
92.57 |
Iron Ore Concentrates, (Non-Agglomerated) (88.44%); Copper Ore (4.50%) |
|
Coal |
56.73 |
Bituminous Coal (99.59%); Anthracite Coal (0.41%) |
|
Oil & Gas |
56.36 |
Liquified Natural Gas (LNG), (78.99%), Crude Petroleum (12.53%) |
Source: UN Comtrade
By trading value, three markets stand out. China leads at USD 102.62 billion, with non-agglomerated iron ore concentrates accounting for 67.47% of exports and bituminous coal contributing 8.07%, highlighting the continued concentration of the bilateral trade relationship in bulk commodities. Japan follows at USD 30.62 billion, led by bituminous coal at 58.62%, while non-agglomerated iron ore concentrates account for a further 15.80%. South Korea ranks third at USD 19.86 billion, with exports more evenly distributed between bituminous coal at 26.97% and non-agglomerated iron ore concentrates at 22.94%.
|
Country |
Exports (USD Billion) |
Leading Products / Share |
|
China |
102.62 |
Iron Ore Concentrates, Non-Agglomerated (67.47%); Bituminous Coal (8.07%) |
|
Japan |
30.62 |
Bituminous Coal (58.62%); Iron Ore Concentrates (Non-Agglomerated) (15.80%) |
|
South Korea |
19.86 |
Bituminous Coal (26.97%); Iron Ore Concentrates, Non-Agglomerated (22.94%) |
Source: UN Comtrade
Australia’s next export wave will be shaped less by expanding traditional commodity trade and more by converting emerging strategic developments into durable commercial flows. That means turning the US–Australia critical-minerals frameworks announced USD 8.5 billion project pipeline into operating capacity and actual shipments, rather than allowing it to remain concentrated in financing commitments and letters of interest. It also requires managing a US tariff relationship that, despite two decades of free-trade access, has shifted three times within the past year. With the United States and India now leading Australia’s new-corridor opportunities, the larger opportunity may lie not simply in exporting more, but in determining which markets will anchor the next generation of Australian trade.
Who We Are:
About 6Wresearch: It is a commercial strategy and growth advisory firm founded in 2011 and headquartered in New Delhi, India, with partners across Southeast Asia and the Middle East & Africa. The firm has delivered more than 20,000 commercial engagements for over 2,000 organizations, including Fortune 500 companies, government agencies, and multilateral institutions such as the World Bank and Asian Development Bank. 6Wresearch combines proprietary intelligence, advanced analytics, and sector expertise to help organizations navigate market complexity and drive sustainable growth. These capabilities explain why organizations trust 6Wresearch for reliable commercial insights and confident decision-making.
Our Proprietary Platform: 6W Export GTM
6W Export GTM is 6Wresearch's proprietary trade intelligence and go-to-market platform, built on UN Comtrade data and enhanced with 6Wresearch's in-house analytical and simulation models, including system dynamics-based forecasting. Unlike broad, sector-level market sizing tools, 6W Export GTM operates at the individual product level — down to specific HS codes and micro-segments — to identify precise, actionable export opportunities by country and product pair, including markets where trade currently does not exist. This granular, simulation-driven approach allows 6W Export GTM to surface opportunities that sector-wide analysis typically misses, positioning it among a small number of platforms globally offering this depth of product-and-country-specific export intelligence.
For more insightful trade intelligence, market reports, and data-driven industry insights, follow 6Wresearch’s LinkedIn and stay updated with our latest research and analysis.

 English
 Arabic
 French
 Spanish
 Portuguese
 Deutsch
 Turkish
 Dutch
Dutch
 Italiano
 Romaian
 Portuguese (Brazil)
 Greek
Greek
